The Data Wizard: easy access to Polder2C’s research data
- 25 November 2021
- Francien Horrevorts
- Knowledge Infrastructure
During the Polder2C’s project many different tests and experiments are done. All these tests involve a great variety and quantity of data. These data need to be stored properly and be available to maximise the outreach. The Data Wizard is being developed for this reason.
Ammar Aljer, Dr in Informatics, researcher in Smart Cities at Lille University has been working on the development of the Data Wizard for over a year now. He gives an update of the current status.
New tool
Why do we need a new tool? Ammar explains: “The quantity of data is multiplying exponentially in the world. The objects in the internet of things alone are now three times more than the world population.

In its primitive form, people are unable to comprehend this data and to make use of it. The purpose of the Data Wizard is to extract the knowledge from different Polder2C’s datasets and to facilitate access to this knowledge and comprehensible data using a user-friendly interface.”
Context
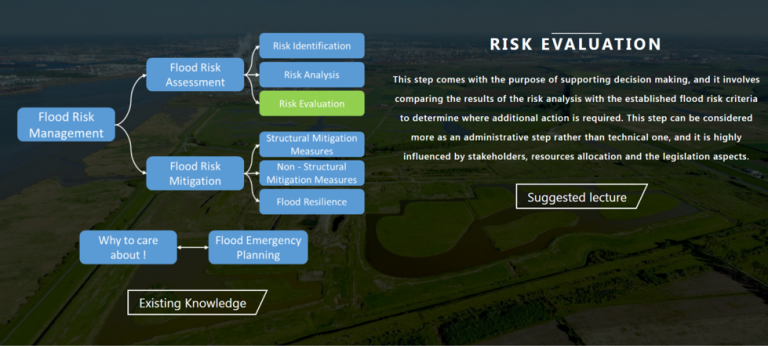
The goal is to convert data into meaningful knowledge by providing the right context. Ammar: “Since the early steps of data production in Polder2C’s we ask our partners ‘how and why’ we generate new data and what this data means. We combine the answers with the datasets to let the user understand the existing knowledge. Then we explain how the data produced in the Polder2C’s project helps to develop the new desired knowledge.”

Flow chart of existing and new knowledge in Data Wizard
Data Wizard
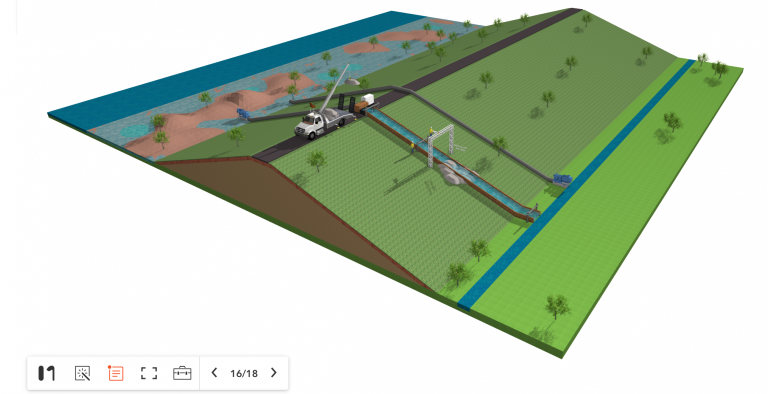
The Data Wizard offers the context to understand the data. Different available knowledge resources were classified regarding their contents and their form (article, video, photos, web-page, etc.) and presented using an interactive comprehensive knowledge tree. The objective, the procedure, monitoring and the outcomes of each experiment are added to the Data Wizard. Visitors can use interactive graphs to explore the data and they can download the data to make their own models. All the information is offered with simplified visual elements and with a 3D interactive model of the experiment. Interpretation of the data is made as simple and accessible as possible. “This is important, because in the end, the Data Wizard will be open not only to the scientific community, but also to students and the general public.” explains Ammar.
"The Data Wizard is a great tool to convert raw data into human knowledge! "
Ammar Aljer

3D visualisation of an overflow experiment
Plans for development
The Data Wizard is still being developed. Ammar: “We try to add more experiments to the available template. One of the plans for development is to provide different ways to access the data regarding the user class: researcher, student, professional, etc. We are also thinking about what we need to do with other datasets." A lot of data is used from the DDSC, the Dike Data Service Center in the Netherlands. The DDSC hosts the data and the Data wizard makes a knowledge layer over those data using a user-friendly interface. Ammar: “We try not to copy the data. This keeps the data in the Data Wizard to be an asset. Another issue to be addressed: will we only include the Polder2C’s data or will we update the data in the future and add new experiments? Those examples are decisions we still need to make.”
A development that would make Ammar really proud: “I hope that the principle of our platform will be used in other projects where data is produced. I hope it helps people interpret data and understand them correctly in the context of flood management and more generally to enable humanity to meet its needs and to accumulate its knowledge.”
See Data Wizard
If you wish to see the Data Wizard and check the data and information available, please visit the platform. Note that the tool is under construction and it does not give a complete overview of the experiments and data collected.
